

| Study Source | 혼자 공부하는 머신러닝/딥러닝 Chaper 01-1 |
|---|---|
| Study Date | 2021/10/31 |
Requirements
Our client is a App Market that is popular for cheep and good products.
They started to sell live fishes.
But there was a simple problem, it was that the employees can not classify the fish.
This situations delays delivery. So They want you to Auto-Fish-Classification ML.
Let`s solve this.
Auto-Fish-Classification Problem
Product list is here.
| 도미 | Sea bream (Bream) |
|---|---|
| 곤들매기 | Dolly varden trout (Dolly) |
| 농어 | Largemouth bass (Bass) |
| 강꼬치고기 | Pike (Pike) |
| 로치 | Rutilus rutilus (Rutilus) |
| 빙어 | Pond smelt (Smelt) |
| 송어 | Trout (Trout) |
Before start: this dataset is announced at Kaggle. link
First, we found that most of Breams are bigger than 30cm.
But we can not just easily say like "All fish that is bigger than 30cm are Breams. Absolutly."
So we decided to find standard and classify with ML.
Preparing Bream Data
We need some dataset of bream to ML to study itself.
First, we are going to compare Bream and Smelt`s size/weight/...etc.
In ML, classification means distinguish one kind from several kinds(class).
Like the ML in this part, chossing one class in two of `em is called Binary classification.
We will make a new CoLab. Names BreamAndSmelt
Put this dataset in your colab`s code cell. Of course execute it.
bream_length = [25.4, 26.3, 26.5, 29.0, 29.0, 29.7, 29.7, 30.0, 30.0, 30.7, 31.0, 31.0, 31.5, 32.0, 32.0, 32.0, 33.0, 33.0, 33.5, 33.5, 34.0, 34.0, 34.5, 35.0, 35.0, 35.0, 35.0, 36.0, 36.0, 37.0, 38.5, 38.5, 39.5, 41.0, 41.0]
bream_weight = [242.0, 290.0, 340.0, 363.0, 430.0, 450.0, 500.0, 390.0, 450.0, 500.0, 475.0, 500.0, 500.0, 340.0, 600.0, 600.0, 700.0, 700.0, 610.0, 650.0, 575.0, 685.0, 620.0, 680.0, 700.0, 725.0, 720.0, 714.0, 850.0, 1000.0, 920.0, 955.0, 925.0, 975.0, 950.0]
In this list, we can see each bream`s weight and length. We will call this Feature.
We have data now, but is hard to look at. Let`s make it as a graph.
Length as x-axis, weight as y-axis. And each bream as a point.
This is a graph called Scatter plot!
Tip: Package and as in CoLab
Package is a bundle of feature-related functions.
Normally, We need to install this seperatly. But in CoLab, we don`t have to do that.
They already prepared widly-using python packages.
If you want to execute codes in your Local notebook, install as tensorflow.blog/install-python.
Get back to the main course, execute this code in your BreamAndSmelt.
import matplotlib.pyplot as plt

plt.scatter(bream_length, bream_weight)
plt.xlabel('length')
plt.ylabel('weight')

plt.show()
Maybe you can see result graph.
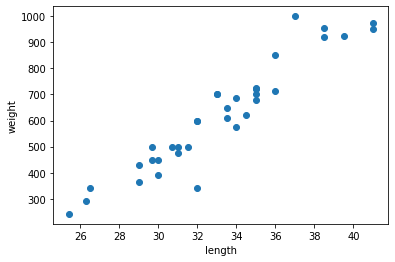
Longer fish, more weights. This graph looks natural.
If Scatter plot graph looks like a straight line, we call this as linear. Remember this word!
Preparing Smelt Data
Similar with Breams.
smelt_length = [9.8, 10.5, 10.6, 11.0, 11.2, 11.3, 11.8, 11.8, 12.0, 12.2, 12.4, 13.0, 14.3, 15.0]
smelt_weight = [6.7, 7.5, 7.0, 9.7, 9.8, 8.7, 10.0, 9.9, 9.8, 12.2, 13.4, 12.2, 19.7, 19.9]
Graph also.
plt.scatter(bream_length, bream_weight)
plt.scatter(smelt_length, smelt_weight)
plt.xlabel('length')
plt.ylabel('weight')

plt.show()
Reason that i did not import matplotlib is just because i already did it in bream`s graph.
Do you see the graph?
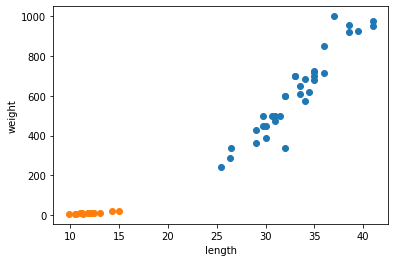
The orange one is smelt, blue one is bream.
Let`s build our first ML Program. DOESN`T IT EXICITING???
The First ML Program.. wow
We will use K-Nearest Neighbors; most simple, understandable one
First, add two lists. (breams and smelts)
length = bream_length + smelt_length
weight = bream_weight + smelt_weight
We are going to use Scikit-Learn package.
To do this, we have to make a 2-dimension list.
Easy way is using zip() of python and list comprehension.
zip() returns elements from input list.
fish_data = [[l, w] for l, w in zip(length, weight)]for takes out elements from length and weight lists, allocate them to l and w.
And then now we have a list that consists of [l, w].
Let`s print it to check.
print(fish_data)Maybe you got a two-dimensional list of the fishes.
[[25.4, 242.0], [26.3, 290.0], [26.5, 340.0], [29.0, 363.0], [29.0, 430.0], [29.7, 450.0], [29.7, 500.0], [30.0, 390.0], [30.0, 450.0], [30.7, 500.0], [31.0, 475.0], [31.0, 500.0], [31.5, 500.0], [32.0, 340.0], [32.0, 600.0], [32.0, 600.0], [33.0, 700.0], [33.0, 700.0], [33.5, 610.0], [33.5, 650.0], [34.0, 575.0], [34.0, 685.0], [34.5, 620.0], [35.0, 680.0], [35.0, 700.0], [35.0, 725.0], [35.0, 720.0], [36.0, 714.0], [36.0, 850.0], [37.0, 1000.0], [38.5, 920.0], [38.5, 955.0], [39.5, 925.0], [41.0, 975.0], [41.0, 950.0], [9.8, 6.7], [10.5, 7.5], [10.6, 7.0], [11.0, 9.7], [11.2, 9.8], [11.3, 8.7], [11.8, 10.0], [11.8, 9.9], [12.0, 9.8], [12.2, 12.2], [12.4, 13.4], [13.0, 12.2], [14.3, 19.7], [15.0, 19.9]]
In our list, 35 Breams and 14 Smelts are existing. Execute this code to labeling them.
(1 is Bream, 0 is Smelts.)
fish_target = [1] * 35 + [0] * 14
print(fish_target)
Follow the code instruction.
from sklearn.neighbors import KNeighborsClassifier 	# import libraries
kn = KNeighborsClassifier()								# make objects
kn.fit(fish_data, fish_target)							# deliver data and target to train it
In Scikit-Learn, we evaluate the model with score() method.
This methods returns value 0 to 1. 1 means it gave the 100% correct answer.
kn.score(fish_data, fish_target)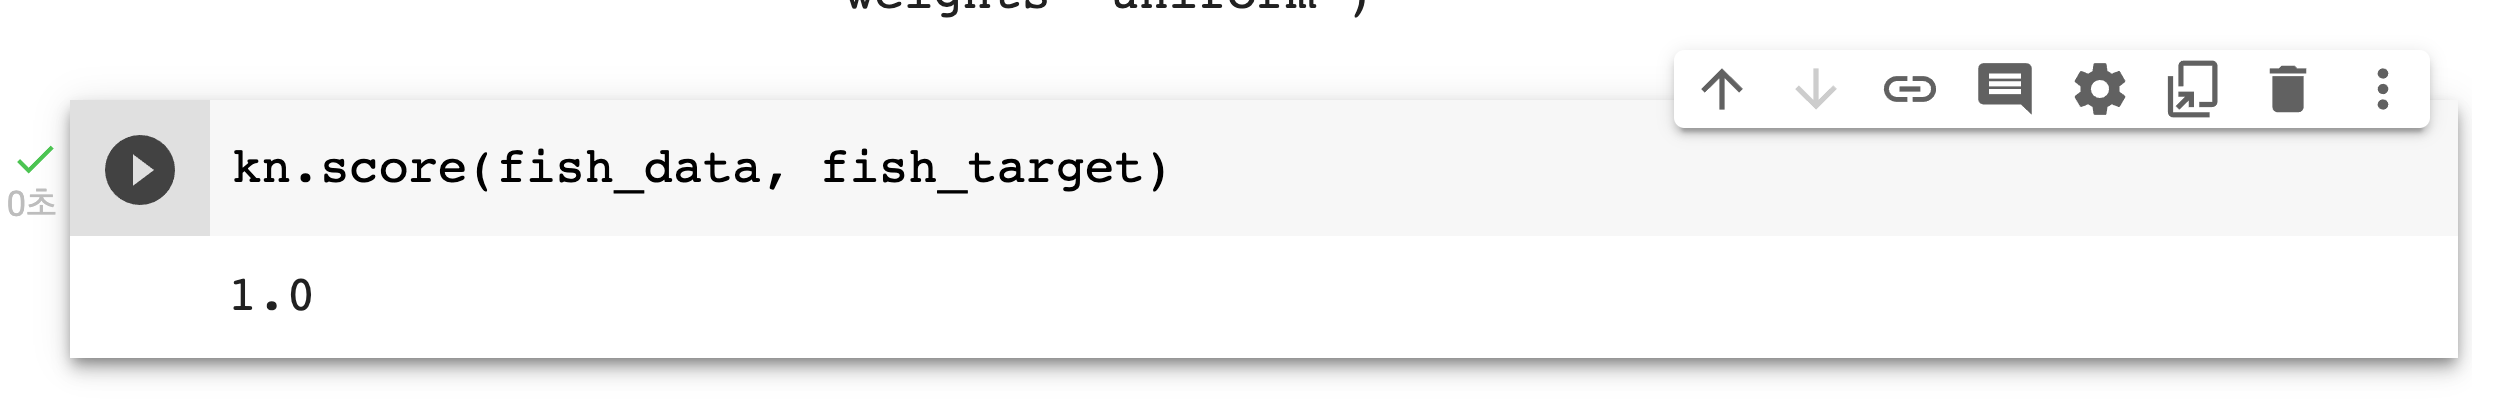
It says 1.0! Good, we can leave work now. (lol)
Just little more study about the algorithm.
This algorithm is very simple. Watch neighbor`s data and select answer as many data says.
For example, a employee brought unclassified fish. It is marked on the graph, STRANGE one.
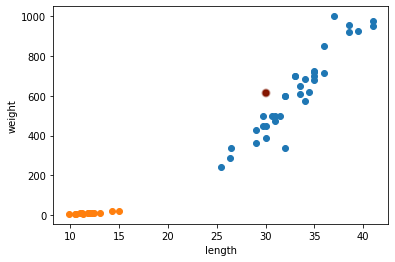
You guys will intuitively think that it is a Bream. `cause there are more breams as data says.
Algorithm is same with that. Let me check it really works!
kn.predict([[30, 600]])
PERFECT!
This algorithm needs us just dataset. Pretty simple.
But it also have a problem. If we have so many data, it will takes much more memory and time.
How `bout the class?
This class have all datas that we conveyed in _fit_X attribute. _y also.
print(kn._fit_X)
print(kn._y)
Now you can see that this algorithm does not train something.
Just calculate and show you the result.
You can also change the range of checking data as giving argument n_neighbors.
kn49 = KNeighborsClassifier(n_neighbors=49)
kn49.fit(fish_data, fish_target)
kn49.score(fish_data, fish_target)
Result is 0.7142857142857143, just same with print(35/49).. 😒
Well, it must be finished here.
Hope to see you again in next post!👏
If you enjoyed or found some errors here,
just contact me in comment, 42 network Slack - kkim, or kwanho0096@gmail.com.
'AI Study Note' 카테고리의 다른 글
| [ML/DL study note] 2-1 Train Set and Test Set (0) | 2021.11.01 |
|---|---|
| [ML/DL study note] 1-2 DevEnv(CoLab, Jupyter Notebook) (0) | 2021.10.31 |
| [ML/DL study note] 1-1 History, AGI/StrongAI, ML, DL (0) | 2021.10.30 |
Comment